What is Data Analysis & Why It Matters?
In today's data-driven world, information is king. But simply having data isn't enough. You need to be able to extract meaning from it, and that's where data analysis comes in.
This article will explain the definition of data analysis, why it is important, the basic ways to do it, and common tools when analyzing data.
What is Data Analysis?
In the book “Big Data, Mining, and Analytics” published in 2014 by author Stephan Kudyba, Data analysis is defined as follows:
“Data analysis is the process of inspecting, cleansing, transforming, and modeling data with the goal of discovering useful information, informing conclusions, and supporting decision-making.”
Speak in a simpler and less academic way: Data analysis is the art and science of extracting valuable knowledge from raw data. Imagine a vast beach overflowing with sand and pebbles. Data analysis is like meticulously sifting through this sand, meticulously separating the pebbles, and then carefully examining each one to find the hidden gems – the truly valuable insights.
The process is multifaceted:
Inspection: First, analysts meticulously examine the data, understanding its source, format, and potential limitations.
Cleaning: Just as seashells might be encrusted with sand, data can be riddled with errors, inconsistencies, and missing values. Data cleaning involves meticulously removing these imperfections to ensure the data's accuracy.
Transformation: The raw data might not be in the most usable format. Data transformation involves restructuring and manipulating the data to make it suitable for analysis.
Modeling: Once the data is clean and organized, analysts can use statistical techniques and modeling tools to uncover hidden patterns and relationships. These models can be used to make predictions, identify trends, and understand complex relationships within the data.
Why is Data Analysis Important?
Data Analysis is important because it plays a big role in all aspects of life, especially at work. For businesses, they can benefit from data research, using the right data to produce products or carry out marketing campaigns.
Specifically:
Boosting Business Performance: Data analysis can reveal areas for improvement in operational efficiency, marketing campaigns, and resource allocation. This empowers businesses to optimize their strategies and maximize their profits.
Sharpening Marketing Campaigns: Data analysis helps marketers understand customer behavior, preferences, and buying patterns. This allows them to target campaigns with laser focus, reaching the right audience with the right message at the right time.
Fueling Innovation: Data analysis allows businesses to identify customer needs and market gaps. This valuable knowledge can be used to develop innovative new products and services that cater directly to customer demands.
Proactive Risk Management: Data analysis can unearth potential risks and vulnerabilities within a business or project. By identifying these risks early on, companies can take proactive measures to mitigate their impact.
How to do Data Analysis
Data analysis is the art of extracting knowledge and insights from information. It's a powerful tool used in almost every field, from business and marketing to science and healthcare.
But how do you actually transform raw data into meaningful discoveries? Here's a breakdown of the five key steps involved in data analysis:
Step 1: Define the Problem
Before diving headfirst into the data, take a step back and ask yourself:
What exactly are you trying to achieve?
What questions do you want the data to answer?
Are you looking to understand customer behavior, predict future trends, or measure the effectiveness of a campaign?
Clearly defining your goals from the outset lays the groundwork for a focused and efficient analysis.
Step 2: Collect Data
Once you know what you're looking for, it's time to gather the data that will help you find it. This data can come from a variety of sources, depending on your needs. Internal databases, customer surveys, social media platforms, and public datasets are all potential treasure troves of information.
The key is to ensure the data you collect is relevant to your research question and of sufficient quality.
Step 3: Clean and Prepare Data
Raw data often comes with imperfections. Imagine a delicious recipe with missing ingredients or unclear instructions. Data cleaning involves addressing these issues to ensure the data is accurate and usable.
This might involve removing errors, inconsistencies, and duplicates. It might also involve formatting the data into a consistent structure that allows for easy analysis.
Step 4: Analyze Data
With your clean data in hand, you can now apply various statistical methods and tools to uncover hidden patterns and trends.
Statistical analysis techniques like correlation analysis can help you identify relationships between different variables.
Tools like data visualization software can help you create charts and graphs that make complex data easier to understand.
Step 5: Communicate Findings
The insights you've gained from the data are valuable, but only if they are effectively communicated.
Present your findings in a clear, concise, and compelling way. This might involve creating reports, presentations, or dashboards that showcase your results and their implications. Remember, your audience might not be data experts themselves, so tailor your communication to their level of understanding.
By following these five steps to do data analysis, you can transform raw data into actionable insights that can inform decisions, solve problems, and drive positive change.
What are Data Analysis Tools?
Data analysis tools are software programs designed to sift through mountains of information, uncovering hidden patterns, trends, and insights. Data analysis tools help us refine raw data into actionable knowledge.
These tools come in a wide range of flavors, catering to different needs and expertise levels. Let's delve into some of the most popular options:
Microsoft Excel
This spreadsheet giant is a household name for a reason. Excel offers a user-friendly interface for data cleaning, organization, and basic analysis. It boasts a range of built-in charts and graphs, allowing you to visualize your data with a few clicks.
While not as powerful as some dedicated data analysis tools, Excel remains a versatile option for beginners and those dealing with smaller datasets.
Google Sheets
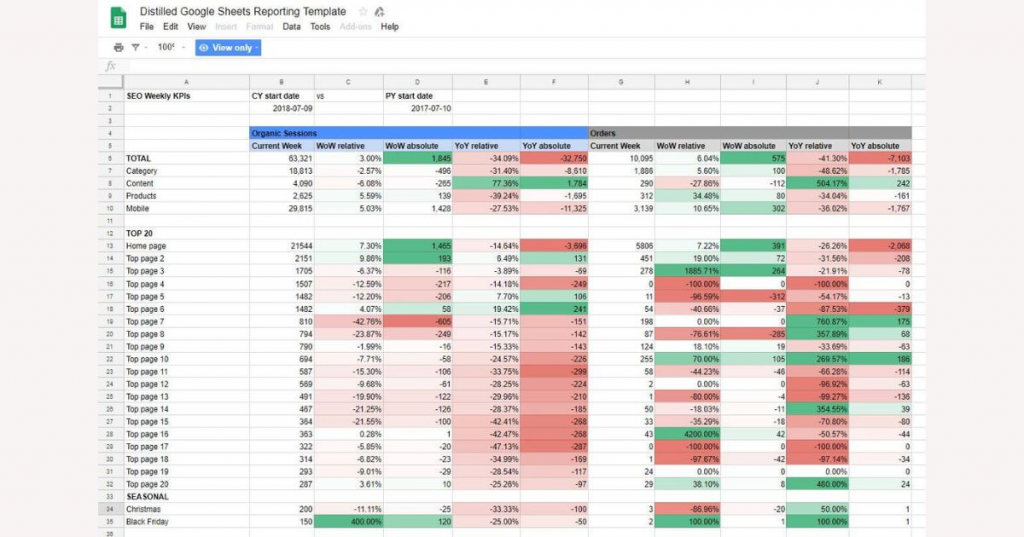
For those who prefer a cloud-based solution, Google Sheets offers a compelling alternative to Excel.
It provides many of the same functionalities as Excel, but with the added benefit of real-time collaboration. This means multiple users can work on the same spreadsheet simultaneously, making it ideal for teamwork.
Plus, Google Sheets is completely free, making it an attractive option for cost-conscious individuals and businesses.
Python
If you're looking for more muscle under the hood, Python is a powerful programming language that has become a cornerstone of data science. While it has a steeper learning curve compared to Excel or Google Sheets, Python offers unmatched flexibility and control.
Its extensive libraries, like Pandas and NumPy, provide a robust toolkit for data manipulation, statistical analysis, and machine learning. With Python, you can truly customize your data analysis workflow to tackle complex problems.
R
Another heavyweight in the data science ring is R. This open-source language is specifically designed for statistical computing and graphics. R boasts a vast collection of statistical packages, making it ideal for in-depth analysis and research.
While R's syntax can be challenging for beginners, its power and focus on statistics make it a popular choice among academics and professional data analysts.
Tableau
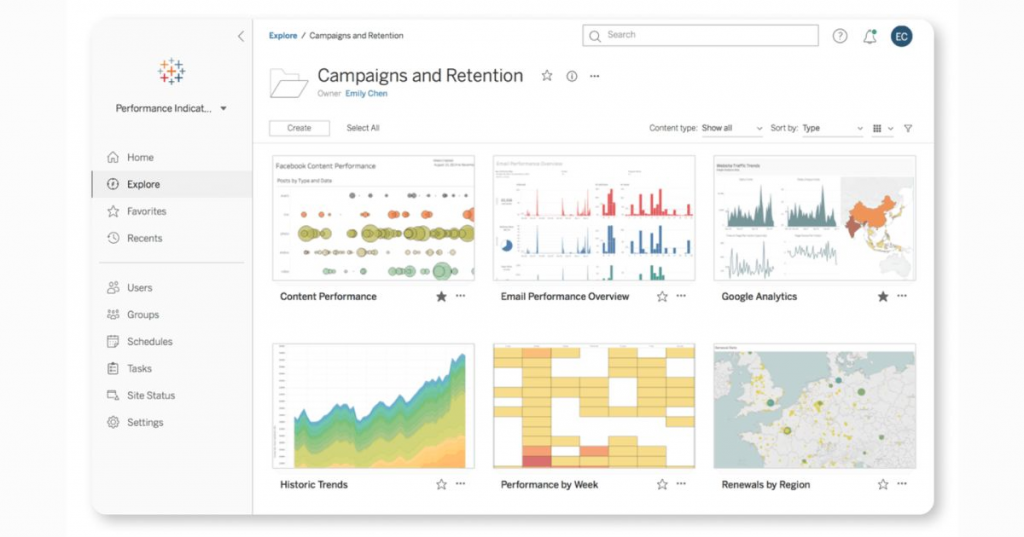
If you're more interested in creating stunning data visualizations than writing code, Tableau is a fantastic option. This user-friendly tool allows you to drag-and-drop data points to create interactive dashboards and charts. Tableau excels at bringing data to life with clear and compelling visuals, making it a valuable asset for communicating insights to a wider audience.
These are just a few examples of the many data analysis tools available. The best tool for you will depend on your specific needs, skillset, and budget. In addition, combining tools and considering their use in special cases is also a point of concern.
What is a Data Analysis Course?
A data analysis course is your gateway to transforming raw data into actionable insights. It equips you with the skills to not only collect and organize information, but also to uncover hidden patterns and trends.
These insights are goldmines for businesses, allowing them to make data-driven decisions that can boost efficiency, improve marketing campaigns, and ultimately increase profits.
What can you expect to learn in a data analysis course?
Foundational Knowledge: The course will establish a strong base in data analysis concepts. You'll learn about different data types, how to measure and analyze them, and how to avoid common pitfalls when working with data.
Data Wrangling Techniques: Data isn't always neat and tidy. You'll gain hands-on experience with cleaning, organizing, and manipulating data to prepare it for analysis. This might involve removing duplicates, correcting errors, and transforming data into a format suitable for analysis tools.
Statistical Methods: Numbers can tell a story, but you need the right tools to understand what they're saying. The course will introduce you to essential statistical methods used to analyze data. You'll learn how to calculate averages, identify correlations, and perform hypothesis testing to draw meaningful conclusions.
Data Visualization Skills: Data is powerful, but it can also be overwhelming. Data visualization tools help turn complex information into easy-to-understand charts, graphs, and dashboards. You'll learn how to create compelling visualizations that effectively communicate insights to both technical and non-technical audiences.
Popular Data Analysis Tools: The course will equip you with the practical skills to use industry-standard data analysis tools. This might include programs like Microsoft Excel for basic data manipulation, SQL for querying databases, and Python or R for more advanced statistical analysis and data visualization.
Who should consider taking a data analysis course?
Individuals looking to launch a career in data analysis: These courses provide a solid foundation for pursuing a role as a data analyst, business analyst, or data scientist.
Professionals seeking to enhance their data skills: Regardless of your field, the ability to analyze data is becoming increasingly valuable. A data analysis course can empower you to make data-driven decisions in your current role.
Anyone curious about the power of data.
If you are looking to find and learn more about data analysis, SkillTrans's available courses will not disappoint you. Learn more in the Data Science course.
Final Thoughts
Data analysis is a valuable skill in today's job market. Whether you're looking to advance your career, make more informed decisions, or simply improve your personal efficiency, learning data analysis is an investment in your future.
