Best 10 Data Analysis Tools for Business
Businesses are inundated with information. But what's the point of having all that data if you can't understand it? That's where data analysis tools step in. These robust platforms assist in turning your data into useful insights, enabling you to make wiser choices and attain superior outcomes.
In this article, we'll delve into the top 10 best data analysis tools for businesses, providing a thorough look at their capabilities and why they're suitable for different business requirements.
Whether you're an experienced data analyst or a beginner, you'll discover the ideal tool to unleash the untapped power of your data.
Microsoft Excel
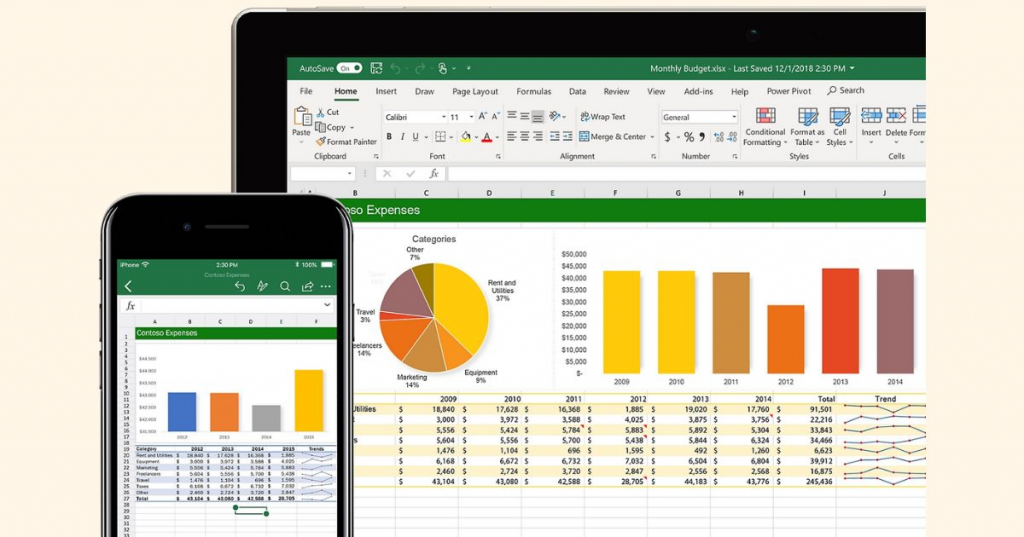
Most people are familiar with Microsoft Excel, a spreadsheet program that allows for data organization, analysis, and visualization. It's a great tool for beginners due to its user-friendly interface and variety of formulas and functions. However, it can be limiting for complex data analysis.
Key Features:
Spreadsheets and Data Organization: The core function – creating tables and spreadsheets to manage and organize all sorts of data.
Formulas and Functions: A vast library of formulas for calculations, data manipulation, and analysis.
Data Visualization: Creating various charts and graphs to present data insights visually.
Collaboration and Sharing: Real-time co-editing and sharing of spreadsheets with colleagues.
Customization: Templates for various purposes and the ability to create macros for automating tasks (with VBA programming knowledge).
Best For:
Anyone who works with data: From basic budgeting to complex financial modeling, Excel is a versatile tool.
Students and educators: Learning and teaching data analysis fundamentals.
Businesses of all sizes: From small businesses managing finances to large corporations using Excel for data analysis across departments.
Pricing:
Free version with limited features: Available online with a Microsoft account.
Paid versions through Microsoft 365 subscriptions: Individual and business plans with varying storage and access to other Microsoft applications like Word and PowerPoint. Price depends on the specific plan chosen. There are also discounted rates for non-profit organizations.
Python

Python is a popular and powerful programming language that's widely used for data analysis. It has a large library of data science tools and frameworks like NumPy, Pandas, and Matplotlib, making it a versatile option for various tasks. While Python offers more advanced capabilities than Excel, it requires programming knowledge.
Key Features:
Extensive Libraries: Powerful libraries like NumPy, Pandas, Matplotlib, Seaborn, and Scikit-learn provide functionalities for data manipulation, analysis, visualization, and machine learning.
Flexibility: Python allows for creating custom functions and scripts tailored to specific data analysis needs.
Open-Source: Freely available and a vast community for support and collaboration.
Best For:
Data Cleaning and Manipulation: Efficiently handling large datasets, dealing with missing values, and transforming data for analysis.
Exploratory Data Analysis (EDA): Analyzing data distributions, identifying patterns and relationships, and summarizing key statistics.
Data Visualization: Creating various charts and graphs to communicate insights effectively.
Machine Learning: Building and deploying machine learning models for tasks like prediction and classification.
Pricing:
Free: Python itself is free to use and install.
Libraries are Free/Open-Source: Most popular data science libraries in Python are free to use. There might be paid commercial licenses for some advanced functionalities, but the core data analysis capabilities are freely available.
Additional Considerations:
Learning Curve: Python has a relatively gentle learning curve compared to other programming languages, but still requires effort to master data science libraries.
Not Point-and-Click: Python requires coding, so it might not be ideal for those who prefer drag-and-drop or point-and-click data analysis tools.
R
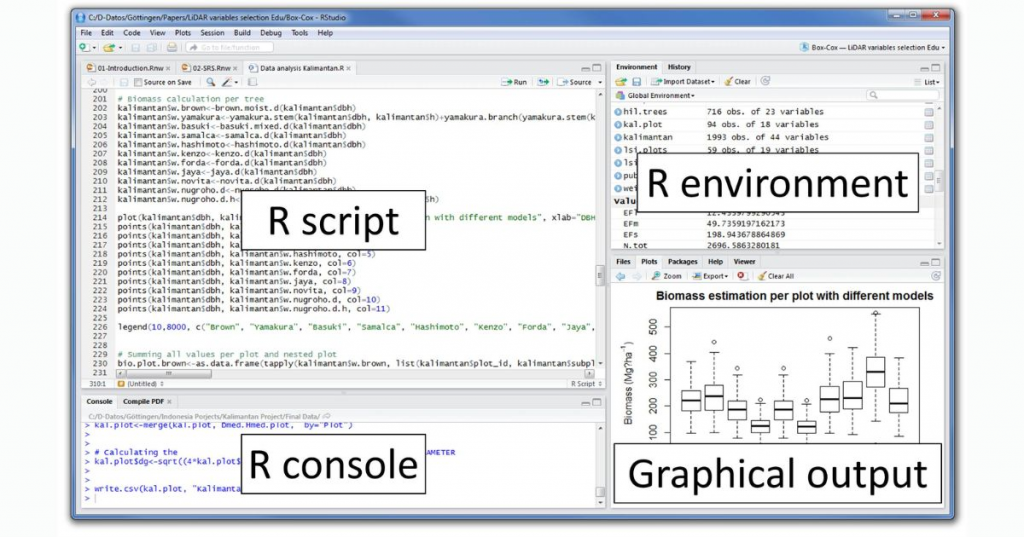
R is another popular programming language specifically designed for statistical computing and graphics. It's known for its strong statistical capabilities and extensive packages for data manipulation, analysis, and visualization. Similar to Python, R requires programming proficiency.
Key Features:
Open-source: Free to use and modify
Statistics powerhouse: Offers a vast collection of statistical methods and functions for complex data analysis
Graphics champion: Creates high-quality and customizable visualizations
Extensible: Huge library of packages for specialized tasks like machine learning, finance, bioinformatics
Interactive environment: RStudio (a popular IDE) facilitates an interactive workflow for data exploration
Best For:
Statisticians and data scientists: Ideal for in-depth analysis and exploration due to its statistical capabilities and flexibility
Data visualization professionals: Excellent for creating publication-quality graphics and complex visualizations
Programmers and developers: Open-source nature allows for customization and integration with other tools
Pricing:
Free! Being open-source, R itself has no cost.
There may be costs associated with specific packages or cloud-based environments where R is hosted.
Jupyter Notebook
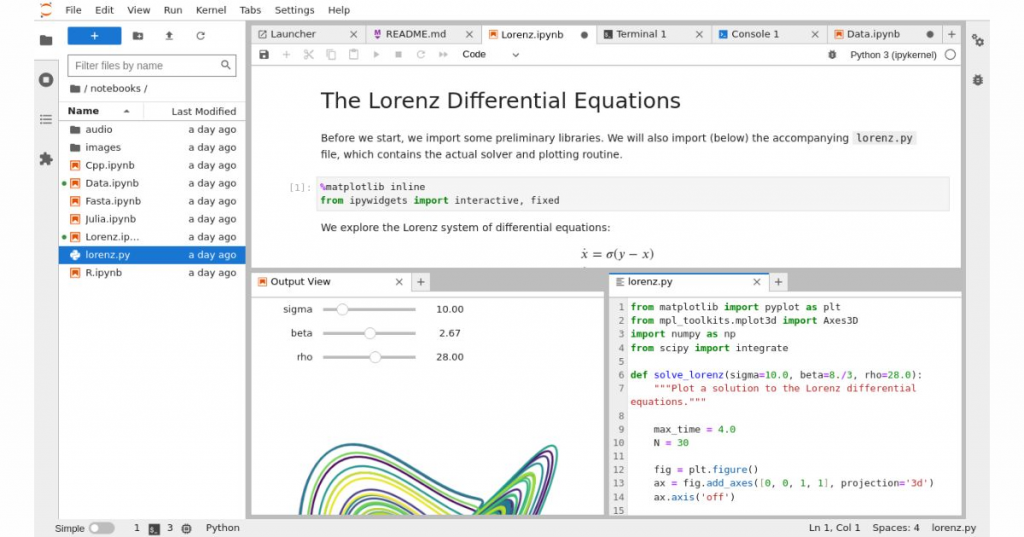
Jupyter Notebook is a web-based application that allows you to create and share documents that combine code, visualizations, and explanatory text. It's commonly used for data cleaning, analysis, and exploration, especially in conjunction with Python or R.
Key Features:
Interactive Environment: Execute code cell by cell and see the output right away, allowing for step-by-step analysis and exploration.
Rich Content: Combine code, visualizations, equations, and text explanations within a single document, making your analysis well-documented and easy to share.
Multilingual Support: Works with over 40 programming languages, making it suitable for various data science tasks.
Best For:
Prototyping and Exploratory Data Analysis (EDA): Quickly test ideas, clean and transform data, and visualize results in an interactive way.
Data Science Communication and Collaboration: Share your analysis with clear explanations and visualizations, fostering collaboration and knowledge transfer.
Education and Learning: Great learning tool for data science concepts due to its interactive nature and ability to combine code with explanations.
Pricing:
Free and Open-Source: Jupyter Notebook is free to use and modify, making it accessible to everyone.
Apache Spark
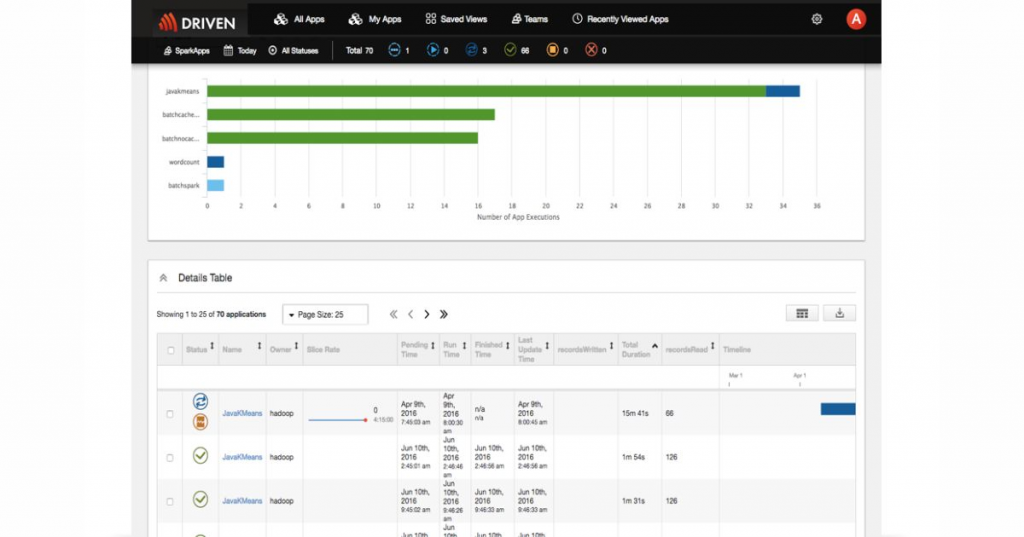
Apache Spark is a powerful open-source framework for large-scale data processing. It's particularly useful for handling big data sets that won't fit on a single machine. Spark excels in distributed computing, allowing you to analyze data across clusters of computers.
Key Features:
Unified Engine: Handles both batch data processing and real-time streaming, allowing you to analyze data as it arrives.
Speed and Scalability: Utilizes in-memory processing for faster analysis, and scales efficiently across clusters of machines.
Multilingual: Supports development in Scala, Java, Python, R, and other languages.
SQL capabilities: Enables familiar SQL queries for data exploration and reporting.
Machine Learning: Integrates with MLlib for large-scale machine learning tasks.
Best For:
Working with massive datasets that won't fit on a single machine.
Real-time data analysis and processing.
Complex data engineering workflows involving multiple steps.
Data science projects requiring large-scale computations.
Pricing: Apache Spark itself is open-source software, so it's free to download and use. However, there may be costs associated with:
Cloud-based deployments on platforms like AWS, Azure, or GCP.
Maintaining your own Spark cluster infrastructure (if not using the cloud).
Microsoft Power BI
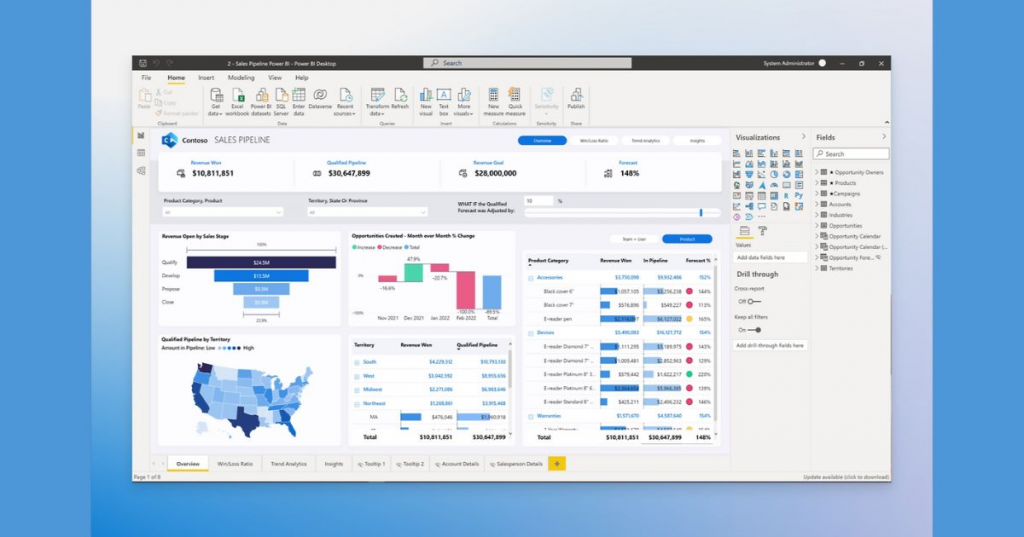
Microsoft Power BI is a business intelligence (BI) platform that provides data visualization and analytics tools. It connects to various data sources, allowing you to create interactive dashboards and reports. Power BI is user-friendly and integrates well with other Microsoft products.
Key Features:
Interactive Data Visualization: Create stunning reports with a wide variety of charts, graphs, and other visuals. You can drag-and-drop elements to customize dashboards and reports.
Data Exploration: Connect to a wide range of data sources and explore your data through intuitive tools.
Collaboration: Share reports and dashboards with colleagues and allow them to interact with the data.
Accessibility: Power BI offers free and paid plans, making it accessible for individuals and businesses of all sizes.
Best For:
Business users who want to easily create and share data insights.
Data analysts who need a tool for data exploration and visualization.
Businesses that want to improve their decision-making with data-driven insights.
Pricing:
Free: Create reports and dashboards for personal use.
Power BI Pro ($10/user/month): Publish reports for others and access additional features.
Power BI Premium Per User ($20/user/month): For large enterprises with advanced needs.
Power BI Premium Capacity (Variable): Provides a shared capacity for a set number of users in an organization.
There's also a "Power BI in Microsoft 365" option that lets you share reports with non-licensed users within your organization, but the pricing for that is variable.
Tableau
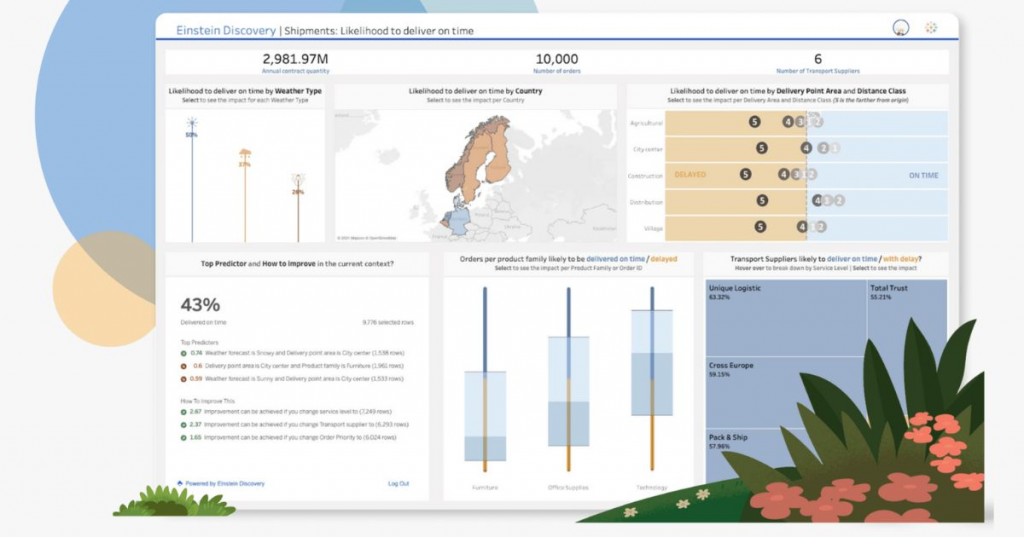
Tableau is another popular BI platform known for its drag-and-drop interface and exceptional data visualization capabilities. It allows you to create a wide range of charts and graphs to communicate insights effectively. Tableau is user-friendly but has a steeper learning curve compared to Power BI.
Key Features:
Drag-and-drop interface: Easy to use, even for people without a programming background.
Data visualization: Creates a wide range of charts, graphs, and dashboards to explore data insights.
Real-time data exploration: Allows you to see how your data changes as it updates.
Mobile access: View and interact with dashboards on your phone or tablet.
Data blending: Combine data from different sources for a more comprehensive analysis.
Advanced analytics integration: Connects with other analytics tools for more complex tasks.
Best For:
Businesses of all sizes that need to gain insights from their data.
People who want to create data visualizations without coding experience.
Teams that need to collaborate on data analysis projects.
Pricing:
Tableau Viewer (starts at $15 per user/month): View and interact with existing dashboards.
Tableau Explorer (starts at $42 per user/month): Explore data and create basic visualizations.
Tableau Creator (starts at $75 per user/month): Full access to all features, including data preparation and advanced visualizations.
They also offer a free version, Tableau Public, for creating and sharing visualizations with public data.
KNIME
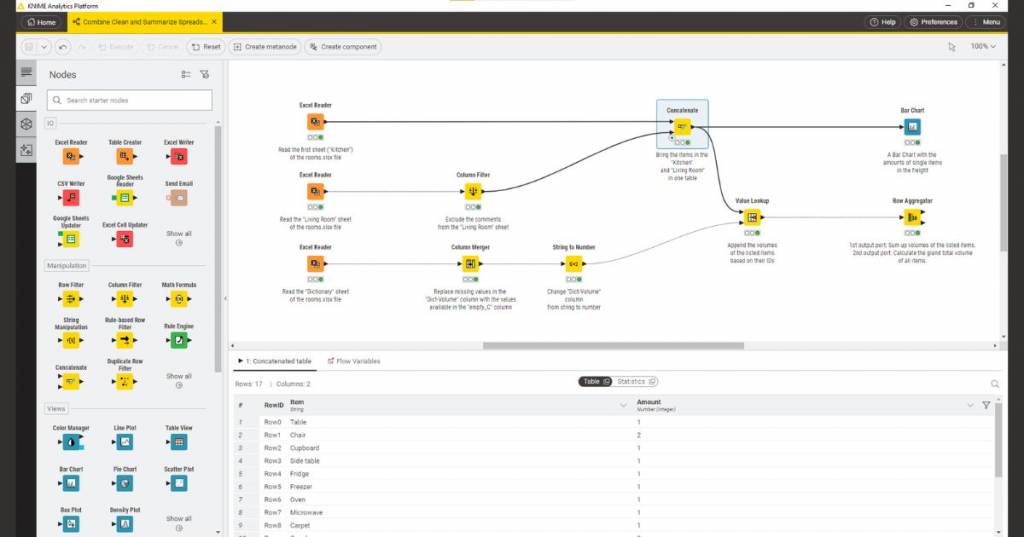
KNIME is an open-source data analytics platform that offers a user-friendly graphical user interface (GUI) for data wrangling, analysis, and visualization. It uses a node-based workflow system, making it easy to build data pipelines without needing to write code.
Key Features:
Free and Open-Source: KNIME is a major advantage for those on a budget or who prefer open-source software for transparency and customization.
Visual Workflows: KNIME utilizes a drag-and-drop interface with pre-built nodes for various data manipulation tasks. This visual approach makes it accessible to beginners and non-programmers.
Modular Design: KNIME offers a wide range of extensions and plugins to add functionalities like machine learning algorithms or data mining techniques.
Integrations: KNIME connects with various data sources and other data science tools, allowing for a smooth workflow.
Best For:
Beginners in Data Analysis: The user-friendly interface and visual workflows make KNIME a great platform to learn data analysis fundamentals.
Data Scientists looking for a Rapid Prototyping Tool: KNIME's visual environment allows for quick exploration and testing of data analysis ideas.
Businesses Wanting Self-Service Analytics: KNIME empowers business users to analyze data without relying solely on data scientists.
Pricing:
KNIME Analytics Platform: Free and Open-Source
KNIME Business Hub: A commercial product with additional features for large-scale collaboration and deployment of analytics within organizations (pricing details are available on the KNIME website).
Splunk
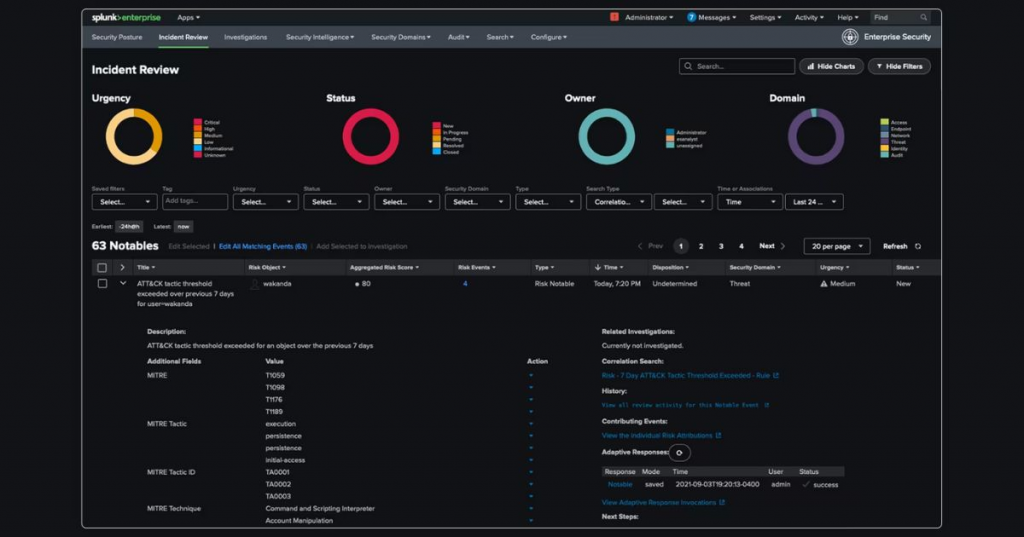
Splunk is a platform for searching, analyzing, and visualizing machine-generated data from various sources like applications, servers, and network devices. It's particularly useful for IT operations and security teams to monitor system performance, troubleshoot issues, and detect threats.
Key Features:
Machine Data Ingestion and Analysis: Splunk excels at collecting and analyzing large volumes of machine-generated data (logs, application data, sensor data) from various sources.
Search and Investigation: It allows users to search through vast amounts of data quickly and efficiently using a powerful query language (SPL).
Data Visualization: Splunk offers a variety of tools for creating insightful dashboards and reports to identify trends and patterns within the data.
Real-time Monitoring: Splunk can monitor IT infrastructure and applications in real-time, enabling quicker detection and resolution of issues.
Security and Compliance: Splunk provides features for security information and event management (SIEM), helping organizations meet compliance requirements.
Best For:
IT Operations and Security: Splunk is a valuable tool for IT operations teams for log management, application performance monitoring, and troubleshooting. Security teams leverage it for security analytics, incident response, and threat detection.
Big Data Analytics: Splunk can handle large and complex datasets, making it suitable for organizations dealing with big data challenges.
Compliance Reporting: Splunk helps businesses comply with various industry regulations by providing tools for data collection, analysis, and reporting.
Pricing: Splunk offers a variety of pricing models with some complexity, so it's best to consult their website for specifics. Here's a general idea:
Cloud-based or On-premise Deployment: Splunk offers both cloud-based (Splunk Cloud) and on-premise deployment options.
Subscription-based: Pricing typically follows a subscription model based on factors like data ingestion volume, compute resources used, and the number of users.
Multiple Pricing Options: Splunk has various pricing structures like Workload Pricing, Ingest Pricing, and Entity Pricing, allowing you to choose the model that best suits your needs.
For a more precise estimate, it's recommended to contact Splunk directly or use their pricing calculator tool.
Looker
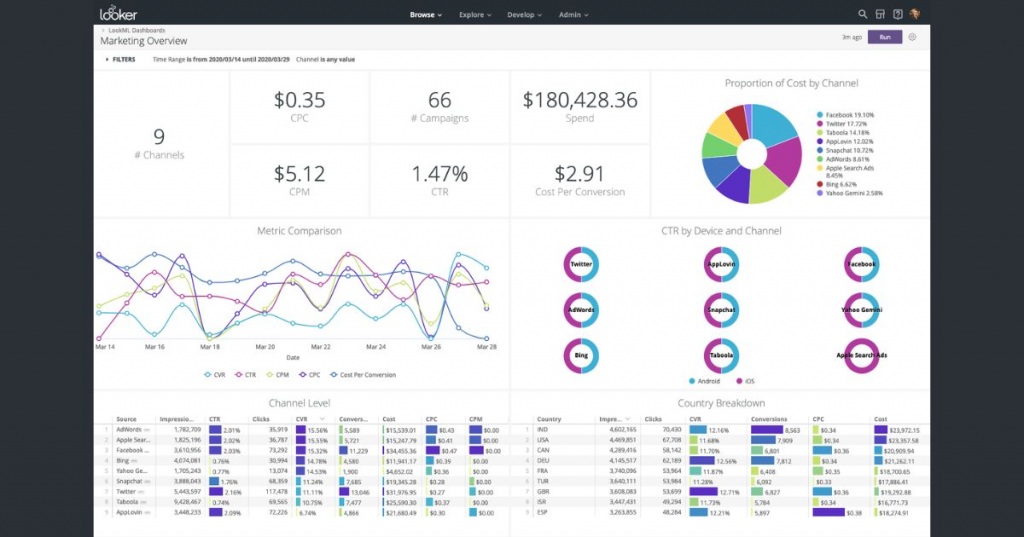
Looker is a BI platform that allows you to explore and analyze data from various sources. It provides a user-friendly interface for creating dashboards, reports, and data visualizations. Looker is known for its strong data governance features and embeds seamlessly into existing applications.
Key Features:
Self-service analytics: Looker empowers users of all technical backgrounds to explore, analyze, and visualize data without relying heavily on IT teams.
Centralized platform: Looker integrates with existing BI solutions, creating a single source of truth for data analysis across the organization.
Data modeling: LookML, Looker's data modeling language, simplifies complex data structures for easy exploration and reduces reliance on SQL expertise.
Secure and scalable: Looker offers enterprise-grade security features and scales to accommodate large datasets and user bases.
Collaboration: Looker facilitates collaboration through shared dashboards, reports, and data exploration.
Best For:
Large enterprises: Looker's scalability, security, and data governance features make it ideal for big companies with complex data needs.
Data democratization: Looker empowers non-technical users to analyze data, fostering data-driven decision making across departments.
Customization: Looker allows for building custom data applications and integrations to fit specific business needs.
Pricing:
Looker's pricing is not publicly available. It typically involves a custom quote based on factors like the number of users, data sources, and deployment scale. However, Looker is generally considered expensive, making it less suitable for startups or small businesses.
Looker Studio, a free version of Looker, offers basic data visualization and reporting for individual users and small teams.
Final Thoughts
The best data analysis tool for your business depends on your specific needs and technical expertise. Consider the size and complexity of your data. Tools like Microsoft Excel might suffice for smaller datasets, while robust options like Tableau or Microsoft Power BI become more relevant for handling big data.
Budget is another crucial factor. Free and open-source options like Python and R offer immense power for those with the technical expertise. However, for businesses seeking user-friendly interfaces and pre-built functionalities, commercially available tools like Looker might be more suitable, even if they come at a cost.
