Difference Between Data Analysis and Interpretation
Understanding the distinction between data analysis and interpretation is fundamental in fields ranging from scientific research or business analytics to everyday decision-making.
While often used interchangeably, these two processes serve distinct purposes in extracting meaning from data. Delving into differences illuminates their roles and contributions to informed decision-making and strategic planning.
So, let's explore the nuances between data analysis and interpretation.
What is Data Analysis?

Data analysis refers to the systematic process of inspecting, cleaning, transforming, and modeling data with the goal of discovering useful information, drawing conclusions, and supporting decision-making. As data continues to grow in volume and complexity, the role of data analysis becomes increasingly vital in leveraging its full potential.
Process of Data Analysis
The process of data analysis includes several key steps.
Data collection is a process of gathering relevant data from various sources, comprising databases, surveys, and sensors, to ensure the quality of the collected data.
Data cleaning, inconsistencies, and duplicates in the data are removed or corrected to get reliable analysis results.
Data transformation converts data into a suitable format or structure for analysis, which normalizes, aggregates, or encodes data.
Finally, data modeling applies statistical, mathematical, or machine learning models to the data. Data visualization creates charts, graphs, and dashboards to represent data visually, making it easier to communicate findings.
Techniques and Tools in Data Analysis
Various techniques and tools are employed in data analysis.
Statistical analysis, including descriptive statistics, inferential statistics, or hypothesis testing, helps analyze data patterns and relationships.
Predictive analysis uses historical data to predict future outcomes using regression analysis, time series analysis, and machine learning algorithms.
Common software tools for data analysis comprise Excel, R, Python, SQL, and specialized software like Tableau, Power BI, SAS, each offering unique capabilities for handling data.
Challenges of Data Analysis
Despite its benefits, data analysis presents several challenges. Poor data quality can lead to incorrect conclusions. Data privacy and security are also significant concerns, requiring the protection of sensitive data from breaches and compliance with regulations like GDPR and HIPAA. Moreover, misinterpretation can result in wrong decisions and strategies.
Applications of Data Analysis
Data analysis has wide-ranging applications across various sectors.
In business intelligence, it enhances operational efficiency, optimizes supply chains, and improves customer satisfaction through data-driven insights.
In healthcare, analyzing patient data improves diagnosis, treatment plans, healthcare outcomes.
In marketing, it segments customers, targets campaigns, and measures their effectiveness.
In finance, data analysis assesses financial risks, forecasts economic trends, optimizes investment portfolios.
In scientific research, data analysis can break into discoveries and insights, pushing the boundaries of knowledge.
What is Data Interpretation?

Data interpretation bridges the gap between data analysis and decision-making, making certain that the results of the analysis are understood correctly and used effectively. The primary purpose of data interpretation is to translate complex data findings into understandable insights, aiding in the identification of significant patterns, trends, and relationships within the data.
Here's a breakdown of the process of transforming data insights into actionable knowledge:
Requirements of Data Interpretation
Data interpretation requires a thorough understanding of the context in which the data was collected. Knowledge of the business, industry, or research domain is fundamental to making meaningful interpretations.
Evaluating the Quality and Relevance of the Data
Evaluating the quality and relevance of the data includes checking for biases or anomalies to warrant the data accurately represents the phenomenon being studied. Understanding concepts of statistical significance determines whether observed patterns are likely to be real or occur by chance, avoiding incorrect conclusions.
Comparing Data
Comparing data across different groups, periods, or conditions assists in identifying significant differences and trends, providing a deeper understanding of how various factors influence outcomes.
Descriptive statistics, such as measures like mean, median, mode, and standard deviation, are used to summarize and describe the main features of the data.
Techniques and Tools in Data Interpretation
Visualization tools like charts, graphs, and dashboards make interpretation easier, with common tools including Tableau, Power BI, and Google Data Studio.
In cases where data is non-numeric, qualitative methods like thematic analysis or content analysis are used to interpret textual or visual data.
Challenges of Data Interpretation
Interpreting complex data sets with multiple variables and dimensions can be challenging. Cognitive biases and preconceived notions can influence data interpretation, so objectivity and critical thinking to avoid misinterpretation. Often, data does not provide clear-cut answers, even uncertainty in the findings. Effectively communicating this uncertainty and the limitations of the data is a mandatory part of making informed decisions.
Applications of Data Analysis
Data interpretation is applicable in a variety of sectors.
In business strategy, interpreting sales data, customer feedback, and market trends helps develop effective business strategies.
In healthcare, analyzing patient data improves treatment plans, diagnoses diseases, enhances patient outcomes.
Public policy benefits from data interpretation to inform decisions, evaluate program impacts, address societal issues.
In scientific research, drawing meaningful conclusions from experimental data advances knowledge and innovation in various scientific fields.
Key Differences Between Data Analysis and Interpretation

Data analysis and data interpretation are closely related processes, but they serve different purposes and have distinct activities. Here are the key differences between data analysis and data interpretation:
| Data Analysis | Data Interpretation | |
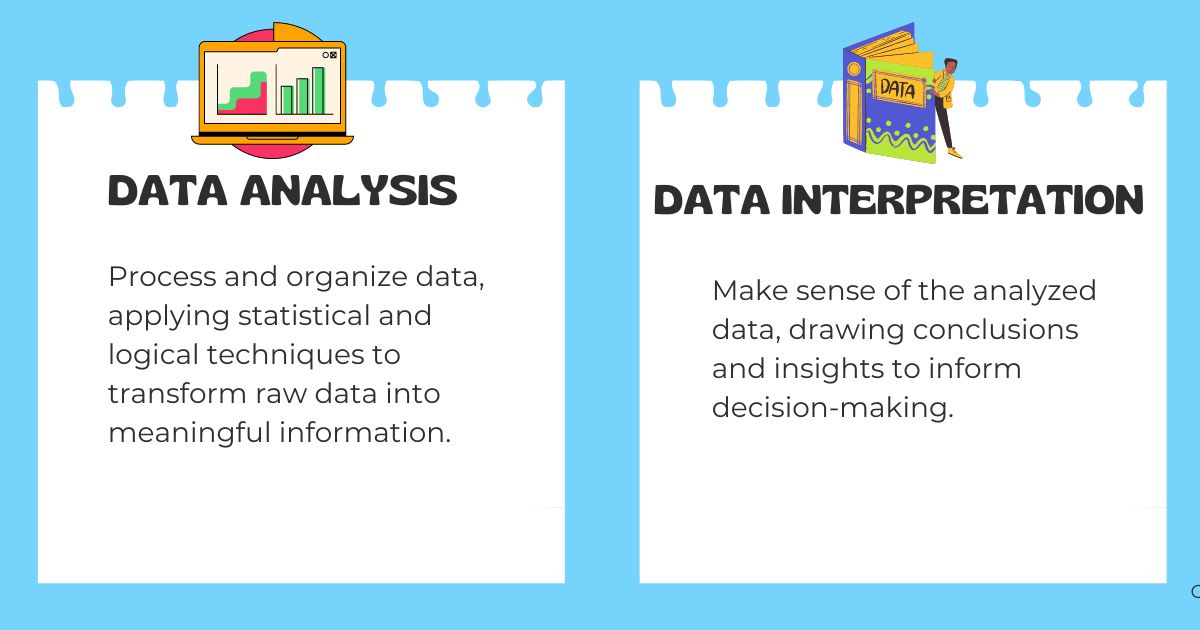
| Purpose | Process and organize data, applying statistical and logical techniques to transform raw data into meaningful information. | Make sense of the analyzed data, drawing conclusions and insights to inform decision-making. |
| Processes Involved |
|
|
| Skills Required |
|
|
| Outputs | The outputs of data analysis are often quantitative, including statistical summaries, models, charts, graphs, and dashboards. These outputs provide a structured view of the data. | The outputs of data interpretation are qualitative insights, conclusions, and recommendations. These outputs are often communicated through written reports, presentations, or strategic plans. |
| Application | Applied during the initial stages of working with data to explore its structure. It is a more technical and method-driven process. | Applied after data analysis to derive meaning from the results. It is a more subjective and contextual approach, focusing on the implications of the data. |
| Examples | A company analyzes sales data to determine average sales, peak selling periods, and regional performance using statistical software combined with visualization tools. | The same company interprets the analyzed sales data to understand why sales peak during certain periods, which marketing strategies are most effective, and how to optimize staffing based on these insights. |
In essence, while data analysis focuses on the technical process of analyzing data, data interpretation is about understanding the implications of the analysis and translating it into meaningful insights that drive informed decisions. Both are essential components of effective data-driven decision-making and research methodologies.
Conclusion
In conclusion, grasping the disparity between data analysis and interpretation is pivotal for anyone navigating the realms of research, business analytics, or decision-making. While data analysis uncovers patterns and trends, it's data interpretation that breathes life into the numbers. Remember, data analysis is about the "what," while data interpretation is about the "so what." Both are essential for turning raw data into actionable insights.
If you want to learn more about knowledge related to this topic, register for Skilltrans courses now.

Meet Hoang Duyen, an experienced SEO Specialist with a proven track record in driving organic growth and boosting online visibility. She has honed her skills in keyword research, on-page optimization, and technical SEO. Her expertise lies in crafting data-driven strategies that not only improve search engine rankings but also deliver tangible results for businesses.


