Statistics: Definition, Types, Importance & Examples
In today's data-driven world, we're bombarded with information from every corner. Numbers, charts, and graphs swirl around us, promising insights and hidden truths. But how do we make sense of it all?
Statistics are much more than just numbers on a page. They're a powerful toolkit that helps us unlock the secrets hidden within data. From business and economics to healthcare and environmental science, statistics play a vital role in interpreting the world around us. This article explores the definition of statistics, its types, importance, and practical examples of its application.
What is Statistics?

Statistics is a branch of mathematics dealing with data collection, analysis, interpretation, presentation, and organization. It plays a crucial role in a wide array of fields, providing essential tools and methods to make sense of data and draw meaningful conclusions.
Here are some areas we can explore in the world of statistics:
Data Collection: How do we gather reliable data? The answers are methods of surveys, experiments, observational studies, and even scraping data from online sources.
Data Analysis: Once we have data, we need to analyze it to uncover patterns and trends. It includes using statistical tools and techniques like calculating averages, measures of spread (variance, standard deviation), and creating visualizations like charts and graphs.
Probability and Statistics: These are two branches of mathematics that underpin statistics. Probability helps us understand the likelihood of events happening, while statistics allows us to conclude data even when we can't be certain about every individual case.
Inferential Statistics allows us to use data from a sample to make inferences about a larger population. For example, we might survey a small group of customers to understand the preferences of the entire customer base.
Applications of Statistics: Statistics are used in almost every field imaginable! It's used in business to understand market trends, in healthcare research to develop new treatments, in sports to analyze player performance, and even in weather forecasting.
Statistics is a vital discipline that enhances our ability to understand and make informed decisions based on data. Its methods and applications span numerous fields, contributing to advancements in science, business, healthcare, and beyond. As data continues to grow, the role of statistics in analyzing and deriving insights from this data becomes increasingly critical.
Types of Statistics
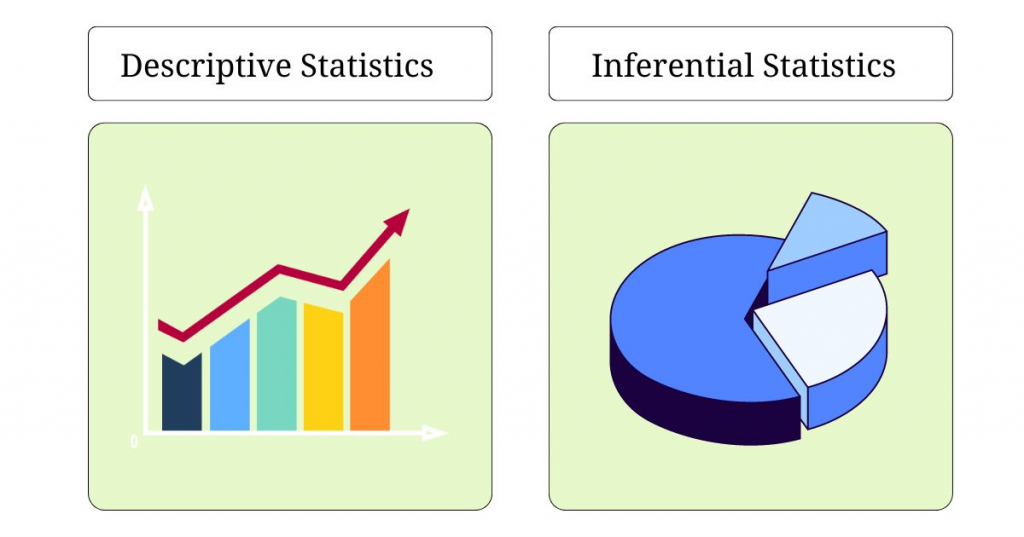
Statistics can be broadly categorized into two main types: descriptive statistics and inferential statistics. Each type serves a distinct purpose and involves different techniques.
Descriptive Statistics
This type of statistic is used to summarize and describe a collection of data (often called a sample or population). It helps us understand the basic characteristics of the data, like its central tendency (think "average"), spread (how varied the data is), and frequency of different values.
Here are some common descriptive statistics:
- Mean: The average of all data points.
- Median: The middle value when data points are arranged in ascending or descending order.
- Mode: The most frequently occurring value in a data set.
- Range: The difference between the highest and lowest values.
- Variance: The average of the squared differences from the mean.
- Standard Deviation: The square root of the variance, representing the average distance from the mean.
- Percentiles: Values below which a certain percentage of data falls.
- Quartiles: Specific percentiles that divide the data into quarters.
- Z-scores: The number of standard deviations a data point is from the mean.
- Histograms: Bar graphs representing the frequency distribution of data.
- Pie Charts: Circular charts are divided into sectors representing proportions.
- Box Plots: Visual representations of the distribution of data based on quartiles.
Inferential Statistics
Inferential Statistics goes beyond just describing the data. It allows us to conclude a larger population based on a smaller sample. Inferential statistics use probability and statistical models to make estimations, test hypotheses, and assess the likelihood of certain outcomes. Key concepts in inferential statistics include:
Estimation:
- Point Estimates: Single values used to estimate population parameters (e.g., sample mean as an estimate of the population mean).
- Confidence Intervals: Ranges of values within which a population parameter is expected to lie with a certain confidence level (e.g., 95% confidence interval).
Hypothesis Testing:
- Null Hypothesis (H0): The default assumption that there is no effect or difference.
- Alternative Hypothesis (H1): The assumption that there is an effect or difference.
- P-value: The probability of obtaining the observed results, or more extreme results, if the null hypothesis is true.
- Significance Level (α): The threshold for rejecting the null hypothesis, often set at 0.05 or 5%.
Regression Analysis:
- Simple Linear Regression: Analyzing the relationship between two variables by fitting a linear equation to the observed data.
- Multiple Regression: Analyzing the relationship between one dependent variable and multiple independent variables.
ANOVA (Analysis of Variance):
- A technique used to compare means of three or more samples to determine if at least one sample mean is different from the others.
Chi-Square Tests:
- Chi-Square Test of Independence: Tests if there is a significant association between two categorical variables.
- Chi-Square Goodness of Fit Test: Tests if a sample distribution matches an expected distribution.
Descriptive and inferential statistics are fundamental to data analysis, each serving different purposes. Descriptive statistics help summarize and describe data, making it easier to understand and communicate. Inferential statistics, on the other hand, allow us to make predictions and decisions about a population based on a sample, providing powerful tools for research and decision-making.
Choosing the right type of statistic depends on your goal. If you want to understand the basic properties of your data, descriptive statistics are a good starting point. If you want to make inferences about a larger population or test hypotheses, inferential statistics are necessary. Understanding both types is essential for effective data analysis and interpretation.
Importance of Statistics

Statistics are fundamental tools used across a wide range of fields. Its importance can be highlighted in various fields and for different purposes:
Making Informed Decisions
Data surrounds us, but statistics help us make sense of it all. By summarizing and analyzing data, statistics allow us to identify trends, patterns, and relationships. It empowers us to make well-informed decisions in various aspects of life, from personal finance (analyzing investment options) to business (evaluating marketing campaigns) to scientific research (concluding experiments).
Business and Economics: Companies use statistical analyses to make informed decisions about product development, market trends, consumer preferences, and financial planning.
Government Policy: Governments rely on statistical data to create policies, allocate resources, and assess the impact of legislation.
Understanding the World Around Us
Statistics are the language of evidence-based understanding. It enables us to quantify the world around us, measure the effectiveness of programs and interventions, and assess the likelihood of future events. This knowledge is crucial for progress in various sectors like healthcare (tracking disease outbreaks and treatment efficacy), education (evaluating teaching methods), and public policy (formulating data-driven regulations).
Unveiling Hidden Patterns
Statistical analysis can reveal hidden patterns and relationships within data that might not be readily apparent. It can lead to discoveries and breakthroughs in various fields. For instance, in medicine, statistical analysis of patient data can help identify risk factors for diseases and develop targeted treatments.
Effective Communication
Statistics provide a powerful way to communicate complex information clearly and concisely. Statistics present information in a way that is easily understandable for both technical and non-technical audiences. It is an essential condition for effective communication in research papers, business presentations, and public awareness campaigns.
Reducing Uncertainty
The world is inherently uncertain, but statistics help us quantify and manage that uncertainty. We can make predictions about future events with a certain degree of confidence. So, we make better risk assessments and planning in various areas, such as weather forecasting, financial markets, and project management.
In conclusion, statistics are a powerful tool that goes beyond just numbers. Their ability to summarize data, identify patterns, and inform decision-making makes them crucial for progress and understanding in almost every field.
The Importance of Statistics in Many Different Fields
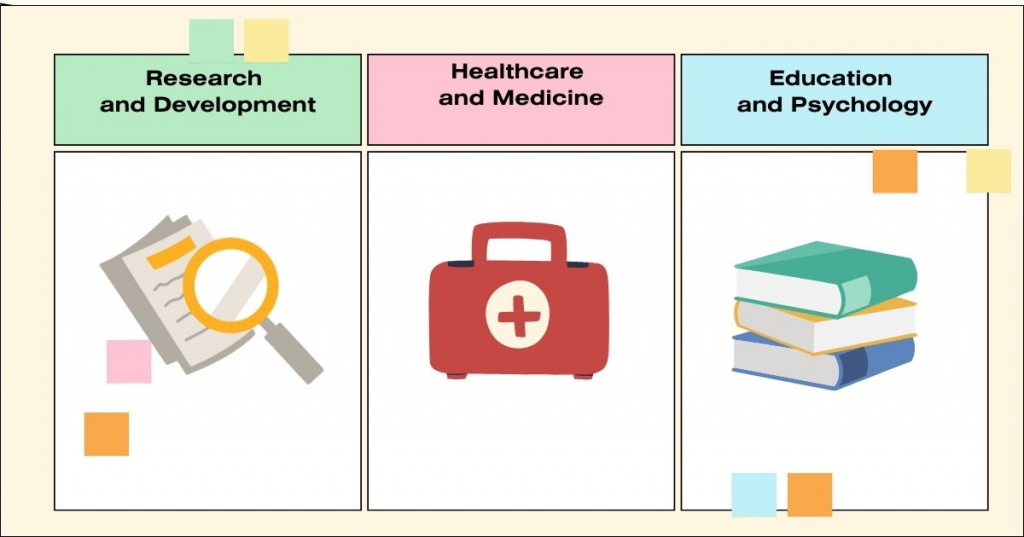
This language of data transcends subject areas, playing a vital role in a wide range of fields. Let's explore how statistics impacts various disciplines:
Research and Development
Research and Development (R&D) is a cornerstone of innovation and progress in numerous fields, from technology and pharmaceuticals to environmental and social science. Statistics plays a vital role in every stage of R&D, ensuring that the findings are valid, reliable, and applicable. Here’s how statistics enhances research and development:
Scientific Research: Statistics is fundamental in designing experiments, collecting data, and interpreting results in medicine, biology, physics, and social sciences.
Technology and Innovation: Statistical methods are used in quality control, reliability testing, and optimizing processes in manufacturing and technology development.
Healthcare and Medicine
Statistics is a fundamental component of healthcare and medicine, playing a crucial role in advancing medical knowledge, improving patient care, and shaping public health policies. Through rigorous data analysis, statistical methods help understand health trends, evaluate treatments, and ensure the effectiveness and safety of medical interventions. Here’s how statistics is utilized in various aspects of healthcare and medicine:
Epidemiology: Statistics helps us understand the spread of diseases, identify risk factors, and evaluate the effectiveness of treatments and interventions.
Clinical Trials: Rigorous statistical analysis ensures that new medications and treatments are effective and safe.
Education and Psychology
Statistics provides the methods and tools necessary to collect, analyze, and interpret data, leading to better understanding, decision-making, and improvements in educational practices and psychological interventions. Here’s how statistics is utilized in these fields:
Educational Assessment: Statistical methods are used to design tests, analyze educational outcomes, and improve teaching methods.
Psychometrics: In psychology, statistics help measure and understand cognitive abilities, personality traits, and other psychological constructs.
Statistics is integral to making sense of data in virtually every field. It provides the tools to collect, analyze, and interpret data, which leads to better decision-making and improvements in quality of life.
Statistics Examples

Here are some real-world examples of how statistics are used in different fields:
Business and Economics
A company surveys a sample of consumers to understand their preferences for a new product. Statistical analysis of the survey data helps determine the potential market demand and informs product development strategies.
Financial Analysis: Businesses use statistical models to predict stock prices, assess investment risks, and optimize portfolios.
Market research: Businesses use statistics to analyze customer demographics, buying habits, and preferences. It helps them develop targeted marketing campaigns and predict market trends.
Sales forecasting: By analyzing historical sales data and market trends, companies can use statistics to forecast future sales and plan their production and inventory levels accordingly.
Healthcare and Medicine
Statistics is the pulse that measures the health of populations, tracks the spread of diseases, and guides the development of life-saving treatments.
Clinical trials: Researchers conduct randomized controlled trials to test the effectiveness of a new drug. Statistical techniques are used to compare outcomes between the treatment and control groups, ensuring that the results are statistically significant and not due to chance.
Epidemiology: Public health officials use statistics to track the spread of diseases, such as COVID-19, and to model infection rates and predict future outbreaks.
Environmental Science
Environmental science tackles the complex challenges facing our planet, and statistics serves as a powerful tool in this fight.
Climate Change: Scientists use statistical methods to analyze temperature records over time, identifying trends and making predictions for future climate conditions.
Wildlife Conservation: Biologists use population sampling techniques to estimate the number of endangered species in a particular area and to monitor changes in their populations over time.
Education and Psychology
Statistics steps in as a powerful tool for educators and psychologists, providing a lens to understand, assess, and optimize learning and behavior.
Standardized Testing: Educational researchers use statistical analysis to ensure the reliability and validity of standardized tests like the SAT or GRE.
Behavioral Studies: Psychologists conduct experiments to study human behavior, using statistical methods to analyze data from control and experimental groups to conclude the effects of different variables.
These are just a few examples, and statistics are used in countless other ways across various fields. They are a powerful tool for making sense of data, drawing conclusions, and ultimately making informed decisions in all aspects of our lives.
Skilltrans introduces you to a range of courses tailored to complement this topic. Please click on the course name below to learn more:
The Fundamentals Of Finance For Non-Finance Professionals
Have you ever been in a position where you’re talking about your P&L, and had nagging doubts about what you were talking about? Have you ever used terms like EBIT or NPV without really understanding what they are or what they mean? Do you see mysterious financial transactions happening that affect your results, but you don’t know how (or if) you can affect them? If any of these are true, this course will remove those doubts and raise your understanding. You’ll be smarter, sound smarter, and be able to make better, faster decisions as a result.
The Complete ISO 31000 Risk Management Standard Course
This comprehensive course is your ultimate guide to mastering ISO 31000. Whether you're new to risk management or a seasoned professional, you'll gain invaluable insights, practical skills, and the confidence to navigate the complex world of risk with ease.
Corporate Social Responsibility (CSR) - An Introduction
There is a lot of misunderstanding what Corporate Social Responsibility really is about- Philanthropy, green PR or indeed a piece of new Conscious Capitalism? This course was designed for you! You, if you want to get to know what CSR is about, first-hand: its development, how it is implemented today and where it is heading in the future. In a bit more than an hour, you will learn the "logics" of CSR and find out how it is really connected to the idea of Sustainability.
Conclusion
The world we live in is brimming with data, and statistics provide the key to unlocking its secrets. Statistics is an indispensable discipline that underpins decision-making and problem-solving across numerous domains. Whether through descriptive techniques to summarize data or inferential methods that conclude larger populations, statistics offer a rigorous framework for understanding variability and uncertainty.
Throughout this article, we've explored the fundamental concepts of statistics, delving into its different types, its crucial role in various fields, and how it shapes our understanding of the world.
If you want to gain more knowledge about Statistics, you can register for Skilltrans courses at preferential prices.

Meet Hoang Duyen, an experienced SEO Specialist with a proven track record in driving organic growth and boosting online visibility. She has honed her skills in keyword research, on-page optimization, and technical SEO. Her expertise lies in crafting data-driven strategies that not only improve search engine rankings but also deliver tangible results for businesses.
