Data Storytelling: How to Tell a Story Through Data?
With the mindset of an insider, we certainly understand the nature of the industry as well as the related weights. Sometimes, this makes us think that outsiders are also aware of the problem like us. This misunderstanding can cause unnecessary confusion.
An effective solution widely used today is Data Storytelling. Data Storytelling is applied in many different industries - business, marketing, or finance. These professions are characterized by the development of massive numbers due to measurement rates and fluctuations. A good data storyteller will create emotions that attract listeners from simple logic. Through Data Storytelling, we can transform dry or difficult numbers into easy-to-understand concepts for many different audiences.
This is a necessary skill that we must master today. In the following article, Skilltrans will help you understand Data Storytelling, its importance, and how to do it in real life.
What is Data Storytelling?

According to the definition of Convince & Convert, Data Storytelling is a method of storytelling with data, transforming statistical numbers into easy-to-understand concepts for target users.
Whether or not data storytelling is effective depends on the topic, story, image, and creativity. In addition to using creativity, we can apply advanced tools to analyze various data, extract information to have a clearer picture of the story to be told.
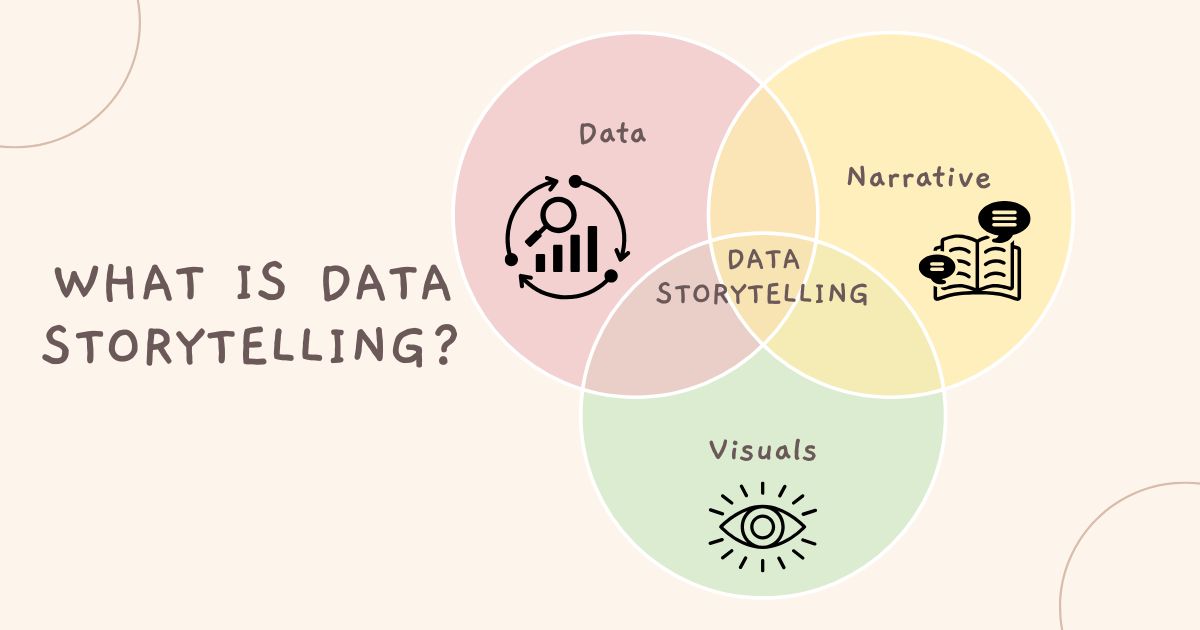
From the above characteristics, we can draw out 3 main components that make Data Storytelling:
Data: Accurate data analysis is the foundation of Data Storytelling. Use methods such as descriptive analysis and predictive analysis to better understand the data.
Narrative: Create a story to convey the insights that marketers draw from the data.
Visuals: Use visual storytelling tools such as charts, images, diagrams, and graphs to clearly explain the story.
The Importance of Data Storytelling
People tend to remember information longer when it is presented in the form of a story, and the same goes for data. Data Storytelling helps to digitalize information, making it more convincing and engaging for audiences who are not familiar with the details shared.
Surely, you will ask why not use visual charts/graphs to present information. You can still use it, but you need to know that a story revolving around that data can help readers understand why those fluctuations and trends occur and their importance.
You will spend a lot of time investing in the quality of your Data Storytelling plan, but this will save you a lot of time and budget in decision-making. In particular, it becomes more convincing when you present ideas, facilitating the elimination of noisy data elements, making information more logical and decisive.
Without using data storytelling techniques, there is a high risk that important information from analytics and data science can be lost or misinterpreted, causing significant damage to the business.
The Role of Data Storytelling for Businesses

Applying various forms of Data Storytelling will bring many benefits to organizations, such as:
Attracting attention
Users tend to prefer images over other content formats because they convey information vividly and clearly. Moreover, images also help readers easily absorb complex concepts without having to read too much text.
That is why you should know how to use graphic design software. These tools support creating visual content and providing useful information to readers.
Conveying messages quickly
The information world is operating at a fast pace, where audiences want to receive news/knowledge in the easiest and most concise way. Data Storytelling helps you present complex information in an easy-to-understand way. The formats are also extremely diverse, including images, videos, diagrams, etc., suitable for many different audiences.
Users tend to prefer images over other content formats because they convey information vividly and clearly.
Help customers make better decisions
Visualizing data and putting it into stories will help consumers make more accurate decisions. By presenting data in a simple and easy-to-understand way, you have helped the audience understand the problem and inspired them to take action.
How to Tell a Powerful Story with Data?
Some data storytelling methods you can refer to are as follows:
Start with a story
Starting with a story is a traditional way of Data Storytelling that is highly effective. An easy-to-understand story will link aspects of the content and help customers visualize it much easier than dry data. For example, famous politicians all have their own stories. Sometimes you don't remember the products they sold or what data they gave in their speeches, but you still remember some of the interesting stories they told. In any story, it is difficult to connect data with the listener. Therefore, data should be combined with images, colors, contexts, or people to become more memorable. Using data storytelling starts with a story.
Make data more interesting
Data is essentially information, so it needs to be arranged and explained reasonably to avoid confusion. Therefore, building a story with data will support the data in becoming more meaningful and easier to arrange. You can consider conveying data in a humorous and interesting way to make it easier for readers to absorb information.
Incorporating stories and data into a specific context
Combining stories and data in a specific context will aid you in looking at the same problem from different angles. This combination, if done correctly, will create a certain connection that helps readers remember faster.
Promote connection
Data conveyed through stories is the best way to help people understand and remember data. If the target audience of the business feels connected to the brand's story, they will want to learn more about your business.
Understanding Your Target Audience
To create a compelling data story, you need to clearly identify your target audience and understand the following factors:
Demographics: Age, education, occupation, location, culture can influence how your audience receives and understands your data story. You should choose a target audience that fits the purpose and content of your story.
Knowledge and expertise: You need to understand your audience's current level of knowledge and expertise on the topic. You should avoid using jargon that is too technical or too basic when presenting your story.
Information needs: You determine whether your audience has a specific need or interest in your data story. You should focus on information that adds value to your audience and solves their problems.
Relevance of information: The information in the data story should be related to the audience's work, interests or daily life. The best way is connect the story to common points or personal experiences of the audience to create connection and understanding.
Differentiation is important with Data Storytelling
In Data Storytelling, differentiation is the most important factor that determines success. The uniqueness of the brand embedded in the story will impress the target audience more than the current mass stories. If your story is not different, customers will not be able to remember the content you want to convey.
5 forms of Data Storytelling
Here are five key forms of storytelling with data, each offering a unique approach to conveying insights:
Report
You can apply the Data Storytelling method to reports. Instead of listing dry data, staff can use charts, diagrams, and visual graphs to tell stories about the business. These stories could be: How has the company's year-end plan proven effective? How has the new software helped employees increase productivity and reduce workload?
Instead of listing dry data, employees can use visual charts, diagrams, and graphs to tell stories about the business.
Internal communication
Talking to people is also a way to tell stories with data. Whether it's a message on the company's social network, an email, or a phone call, marketers can apply Data Storytelling to ensure that information is conveyed effectively.
If a business owner sees that the company is generating more leads through a certain channel, they can share this information on the company's Slack channel. HR can create a short video about it, cut it into several smaller videos, and share them with viewers. From the insights drawn from the video, the company can decide to invest more in that channel and limit waste elsewhere. The good thing about internal communication is that it can create action quickly, and it doesn't take too much time to build information and connect.
However, this storytelling method will not be suitable if you want to convey a lot of data at once. Moreover, there will be some users who prefer information posted professionally and officially. It is best to use this storytelling method for personal insights only.
Dashboard
Dashboard is one of the most popular forms of data storytelling. You can use this method to present analytics, optimization results, or share metrics related to customer experience. However, the nature of the Dashboard is an overview page containing a lot of information that can be overwhelming for viewers.
Infographic
The special feature of infographics is that they can quickly convey messages using both text and charts. However, designing Infographic takes more time and effort.
Newsletter (Email Newsletter)
The newsletter is a newsletter sent via email, containing news, articles, or updated information on a topic that the user has previously registered for. With the above characteristics, HR can apply Data Storytelling in Newsletters to optimize the information sent to consumers. A Newsletter with visual images, graphs illustrating clear data will have more opportunities to be noticed than a regular text Newsletter.
What should you keep in mind when applying Data Storytelling?
When implementing data storytelling, focus on the following:
Information overload
Making readers "bewildered" by a large amount of information is a common mistake in Data Storytelling. While including every data point can be engaging, you still need to distinguish what is important to the particular story. Providing too much data can lead to confusion and lose the audience’s interest.
Lack of context in presenting numbers
Just presenting numbers without explaining the context or factors that influence them can lead to many costly mistakes. They stem from misinterpretation by the audience or lack of data in the Data Storytelling content.
Conclusion
Data is at the heart of many business decisions and operations. However, raw data cannot do the job of clarifying it for customers/readers to understand. You can’t just give your audience some spreadsheets with rows of numbers and hope that they will understand your key message or take action. Data Storytelling helps you present all the information in a way that is most engaging for the reader.
If you wish to become more proficient in Data Storytelling, you can enroll in Skilltrans courses!

Meet Hoang Duyen, an experienced SEO Specialist with a proven track record in driving organic growth and boosting online visibility. She has honed her skills in keyword research, on-page optimization, and technical SEO. Her expertise lies in crafting data-driven strategies that not only improve search engine rankings but also deliver tangible results for businesses.


